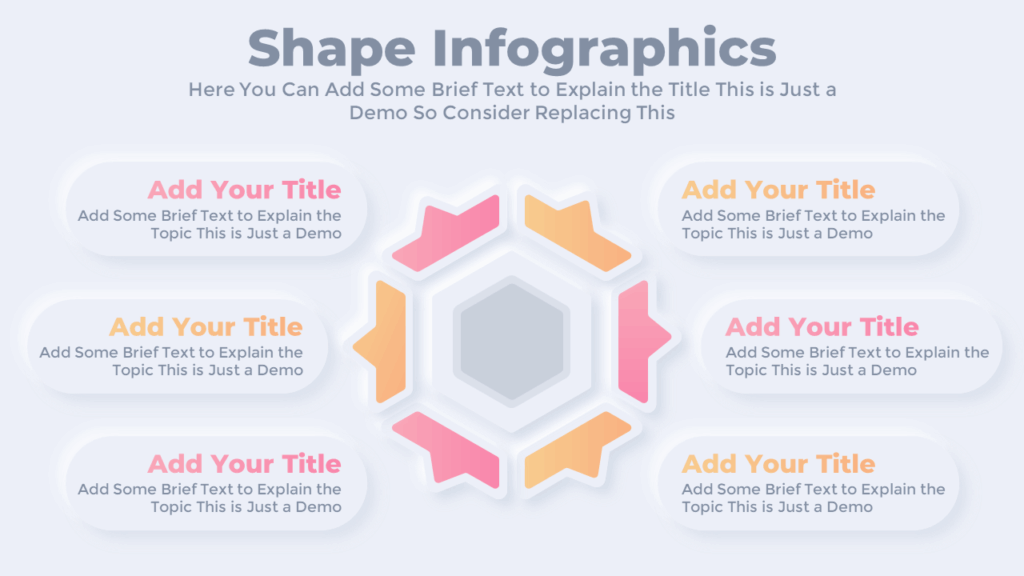
This 6-point infographic template helps you explain a central idea with six related points. Use it to present business functions, strategic breakdowns, or multi-step processes. Its radial layout makes your content visually balanced and easy to understand.
About this 6 Point Infographic Slide
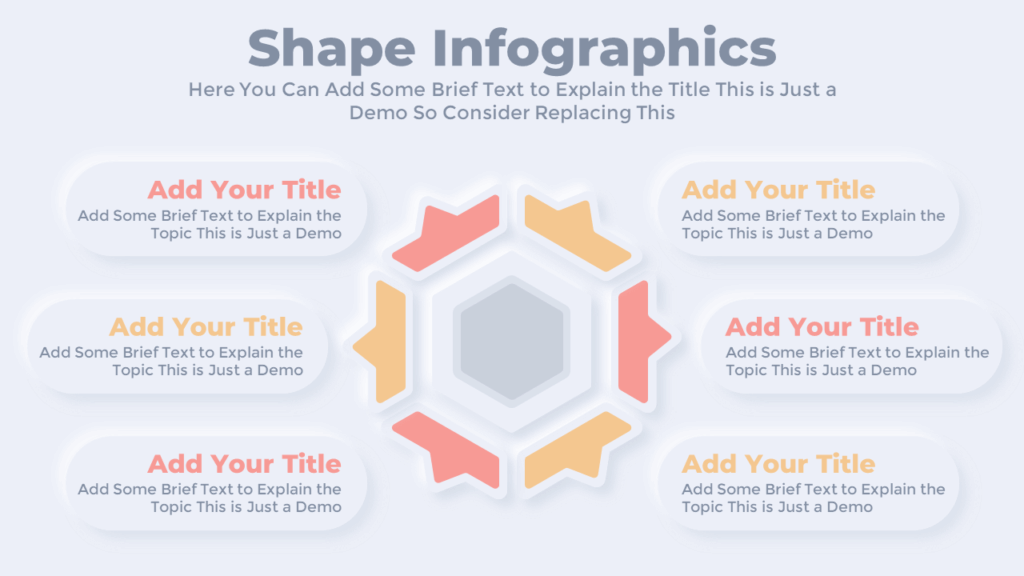
The slide uses a hexagon-centered design with six outward arrows. Each arrow includes a title and description box, perfect for explaining steps or key points. The layout makes it simple to connect outer ideas to one central concept. It’s animated in PowerPoint to keep your audience engaged and compatible with Google Slides.
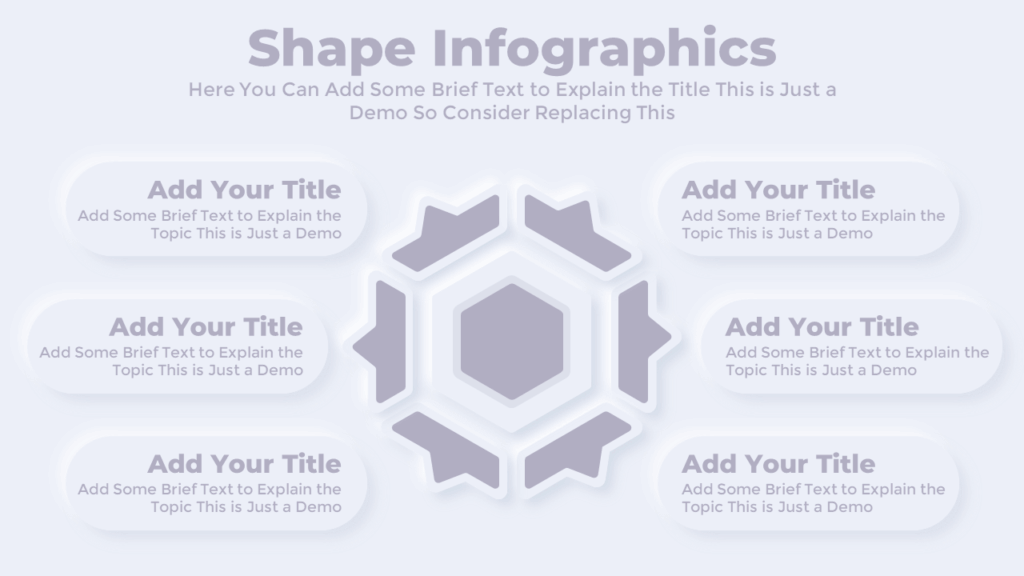
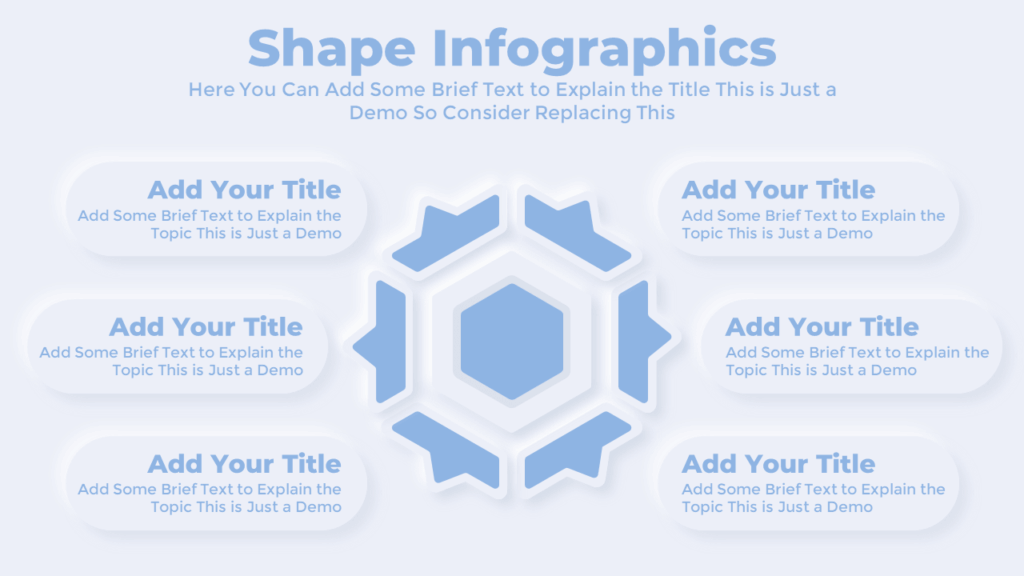
Color Options for this Template:
Download this Infographic Template:
Get this 6-point infographic template to present strategic ideas or process steps clearly. It is ideal for business models or concept breakdowns. You can edit every part-text, colors, or shapes-quickly to match your topic. It is only available to our Patreon sponsors.
Watch the Animated Slideshow Video:
Premium Member
Unlock exclusive and premium templates of PowerPoint School!
Hi there! We’re Team PowerPoint School. Become our premium member on Patreon and unlock exclusive access to all our premium templates.