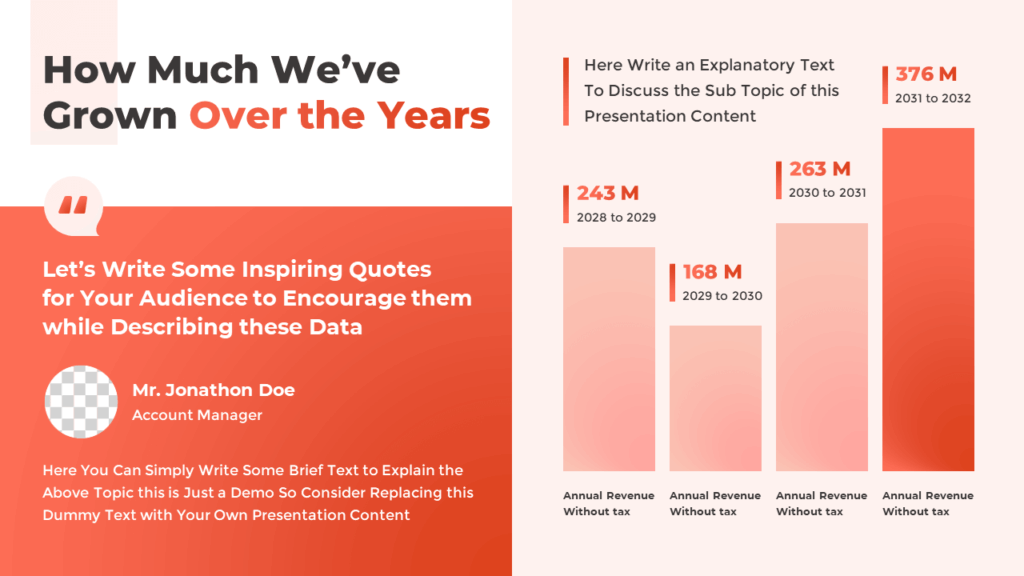
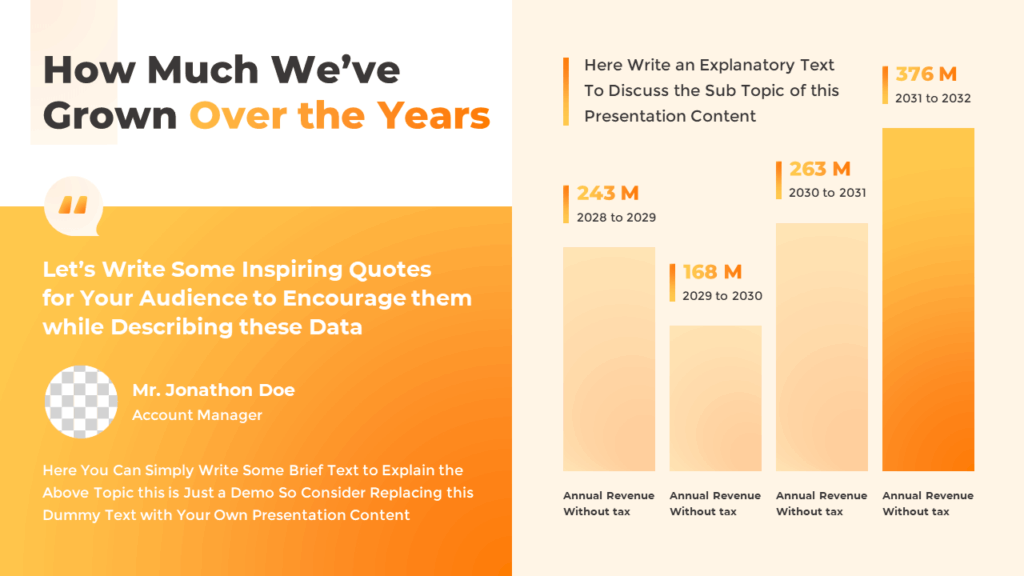
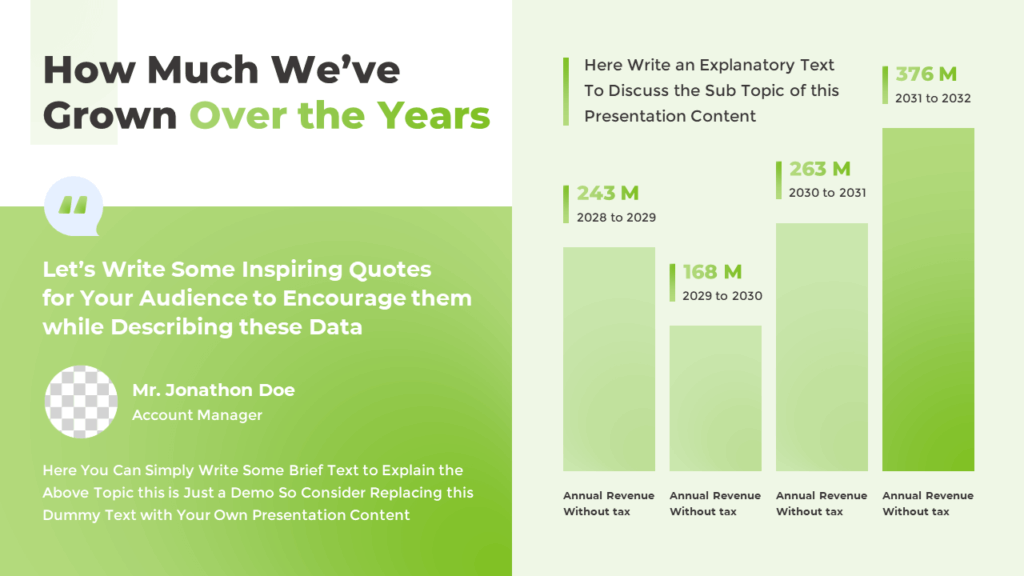
This PowerPoint bar chart template is perfect for showing business or financial growth over multiple years. It is designed for professional presentations, including business performance reviews, revenue growth updates, or yearly comparisons.
About this Bar Chart Template
The slide follows a left-right layout. On the left, you will find a quote section with a circular image placeholder and text area—ideal for adding inspirational quotes or a message. On the right, there is a vertical bar chart that visualizes data across multiple years. It includes PowerPoint animations that make each item appear in sequence, adding a wow factor.
Explore the Available Color Options:

Download this Bar Chart Slide:
Use this bar chart template to explain your business growth or yearly data visually. It is simple to customize and fully compatible with both PowerPoint and Google Slides. It is only available to our Patreon sponsors.
Watch the Animated Slideshow Video:
You can use this slide in board meetings, project reviews, annual reports, or company profiles to show your numbers visually and clearly. Try this bar chart slide and browse our site for more free PowerPoint templates.