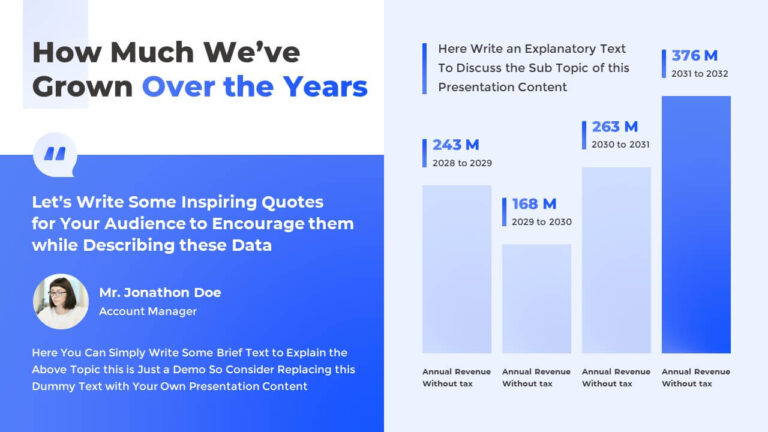
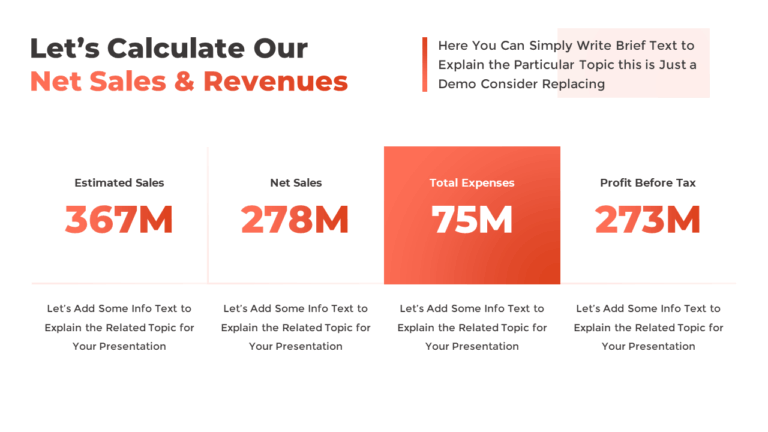
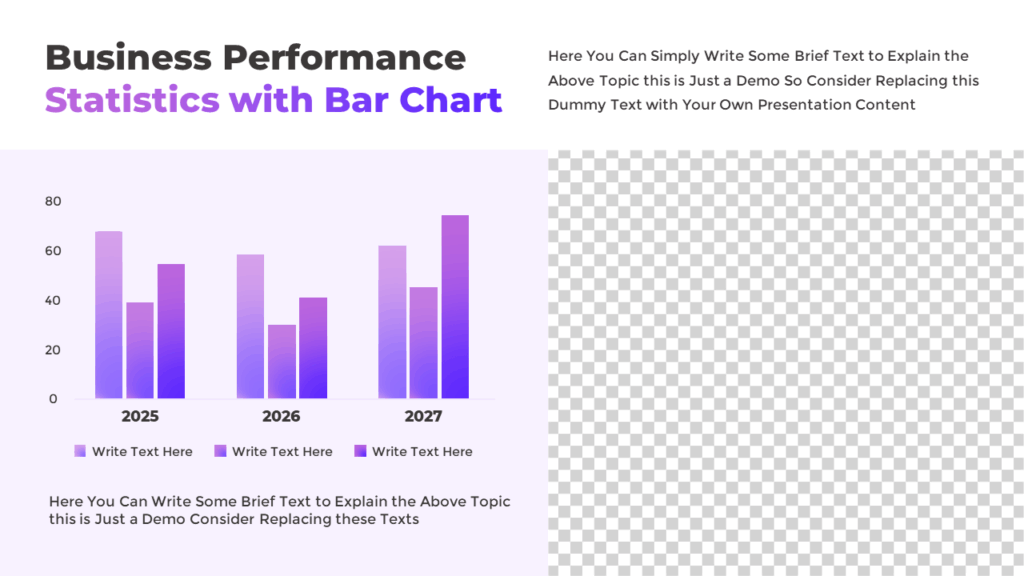
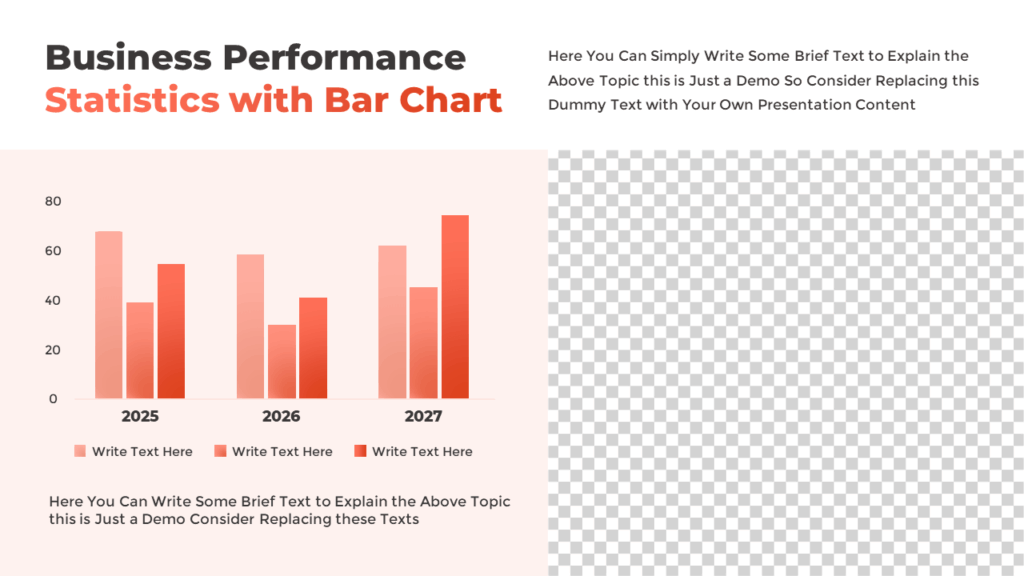
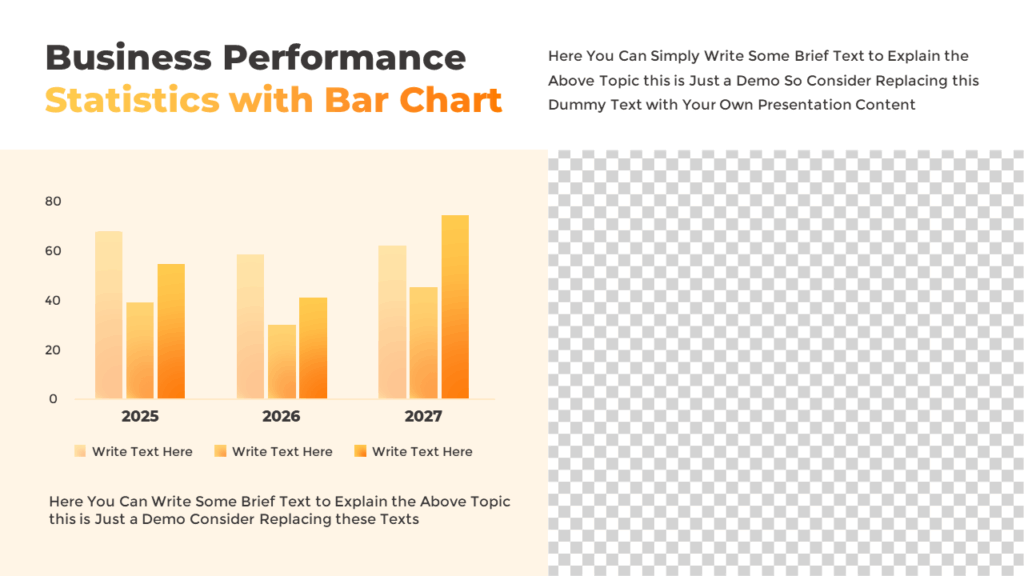
This free bar graph PowerPoint template is perfect for showing yearly business performance, trends, or comparisons. It includes grouped bars for three years to present growth or changes over time. It is useful for business teams, marketers, and analysts who want to visualize multi-year data.
About this Free Bar Graph Template
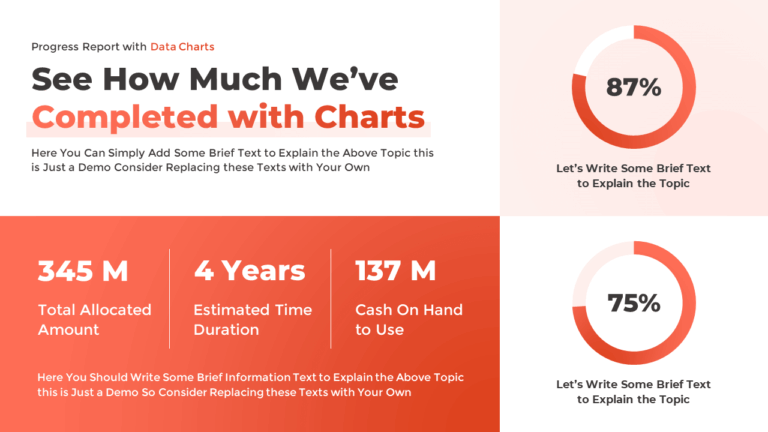
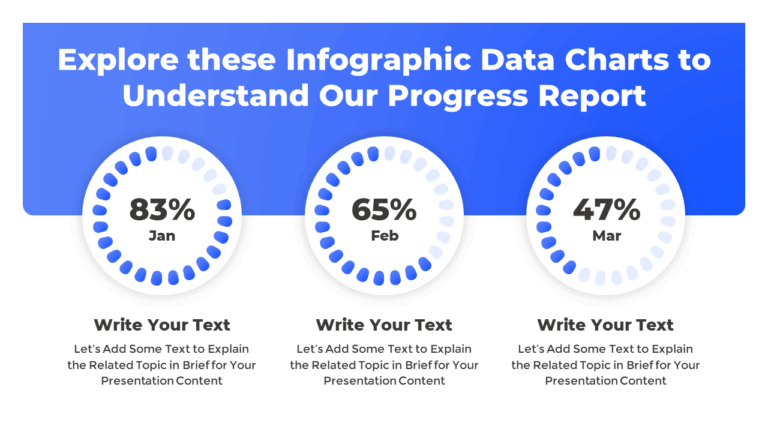
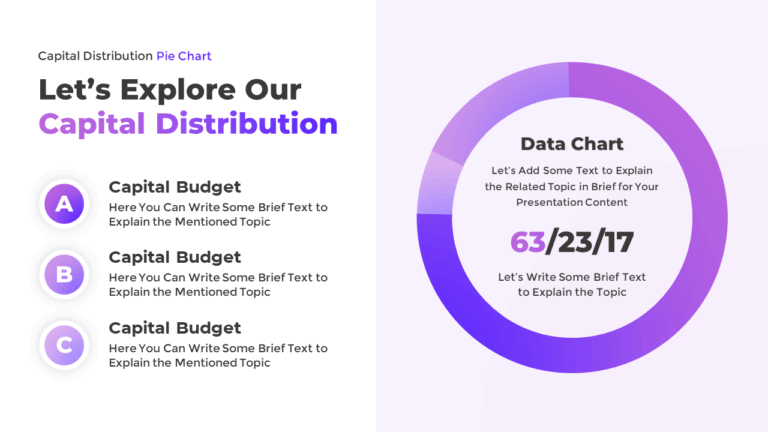
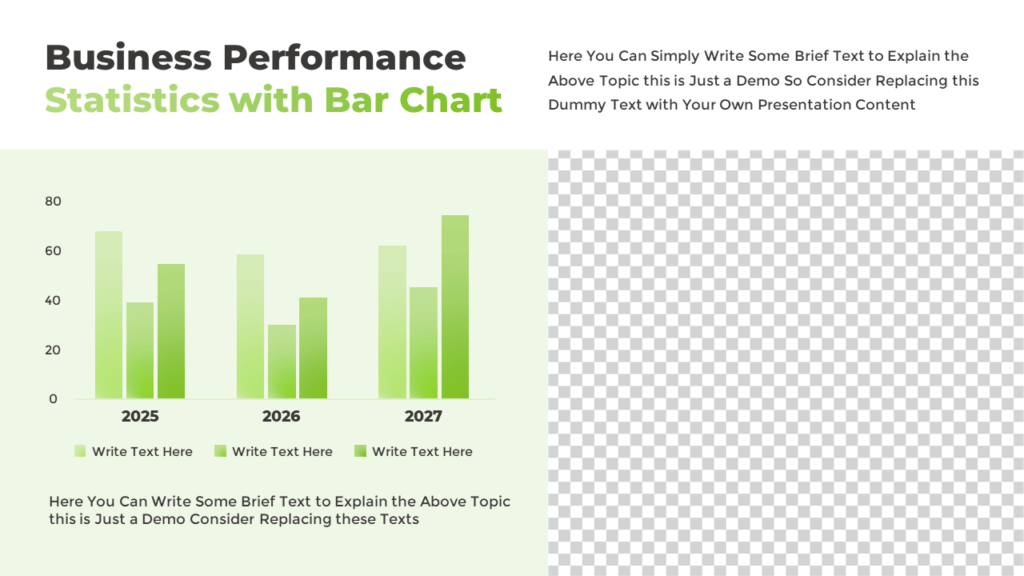
The template includes a three-year grouped bar chart. Each bar enters one by one with PowerPoint animations, helping your audience focus as you present. The chart elements, including colors, labels, and values, are fully editable in PowerPoint and Google Slides.
Explore the Available Color Options:
Download this Free Bar Graph:
Get this free bar chart template to create clear and professional business visuals. It helps you present trends or growth over time with ease.
Watch the Animated Slideshow:
Make your data speak with this animated bar chart template. Explore more free PowerPoint templates on our website to upgrade your presentations.
Check Slides from Other Categories:


Premium Member
Unlock exclusive and premium templates of PowerPoint School!
Hi there! We’re Team PowerPoint School. Become our premium member on Patreon and unlock exclusive access to all our premium templates.