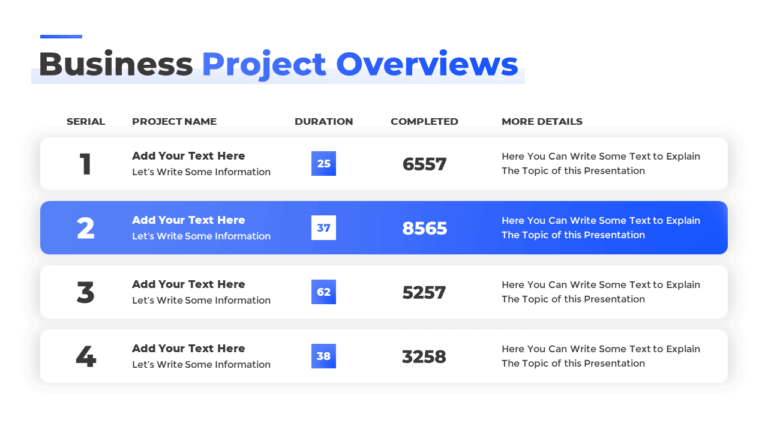
This free feature comparison chart template for PowerPoint and Google Slides helps you display project data or features in a clean table format. You can use it to summarize project details. It is ideal for project reviews, status reports, or feature comparisons.
About this Feature Comparison Chart
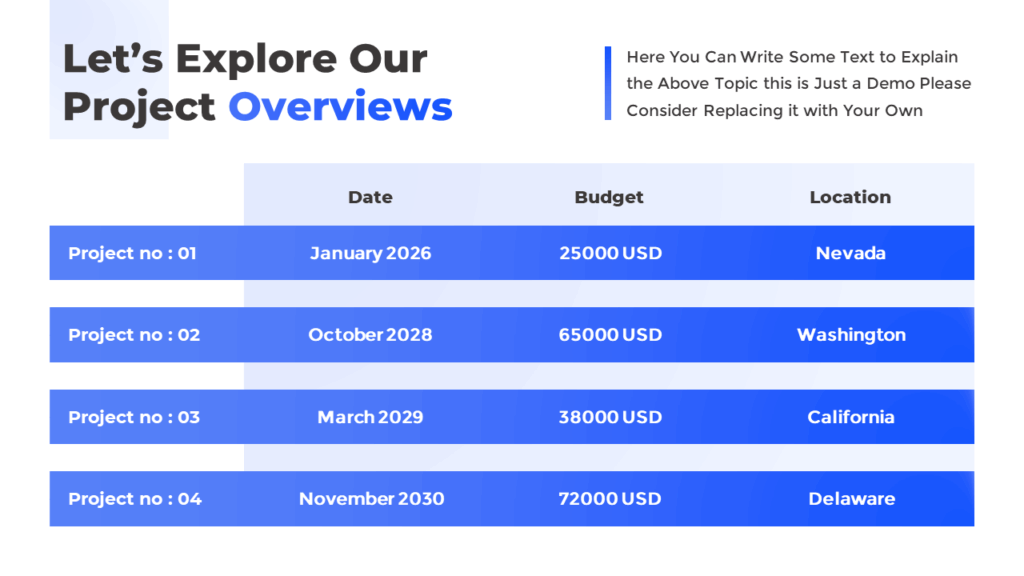
The PowerPoint slide includes a four-column and four-row table design, built with editable text boxes to add your data quickly. Each row enters the slide with smooth PowerPoint animations, keeping the viewer focused. You can use this chart to compare project phases or features. Also, it is fully compatible with Google Slides.
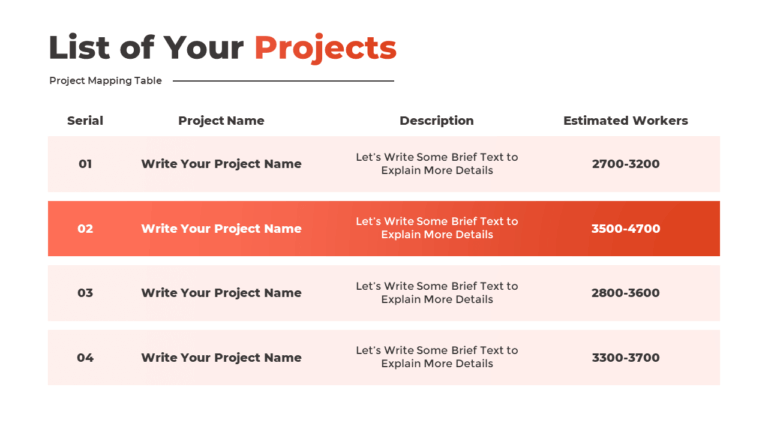
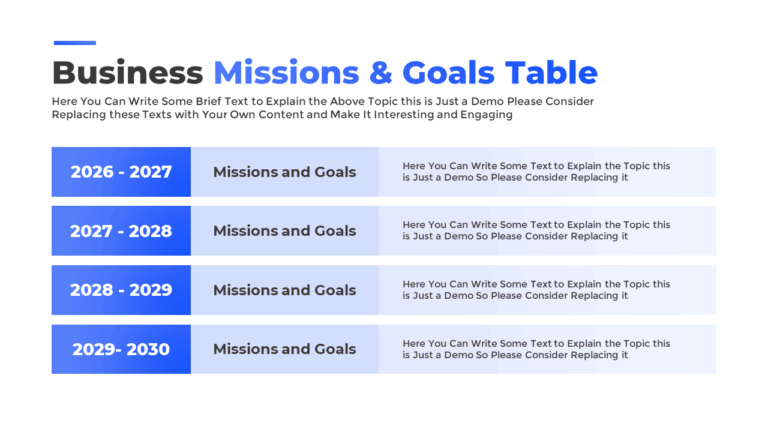
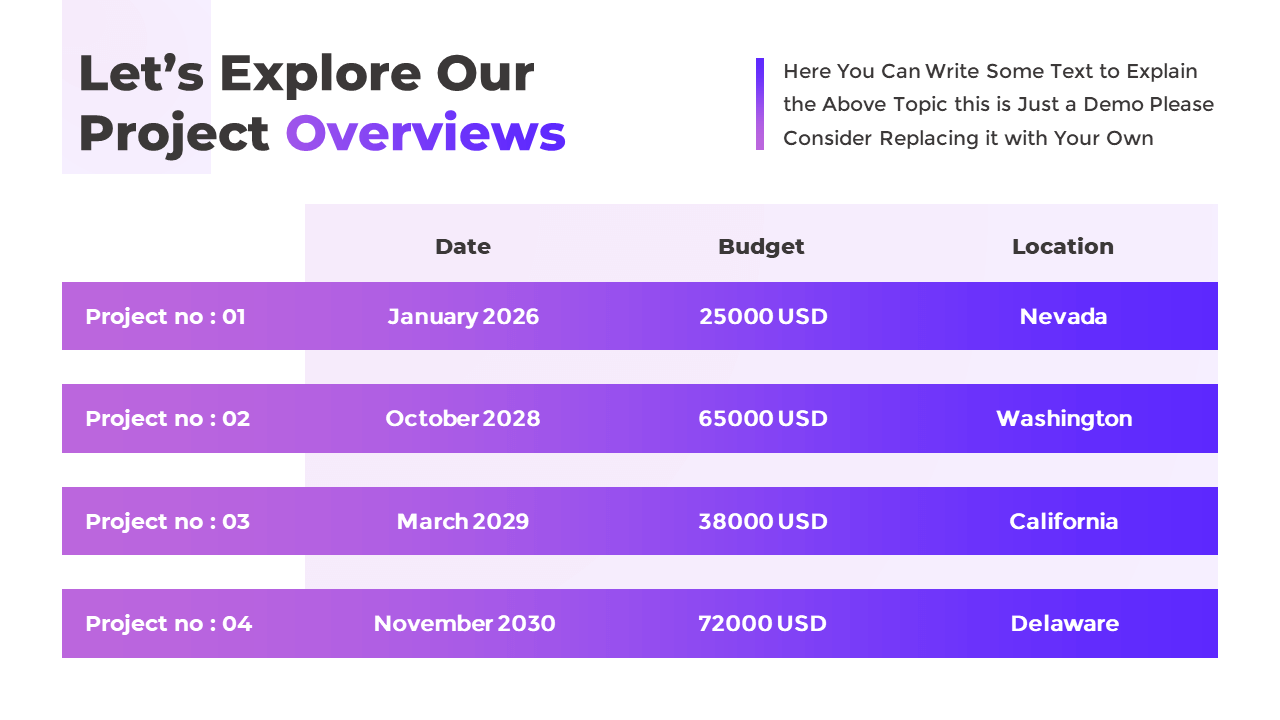
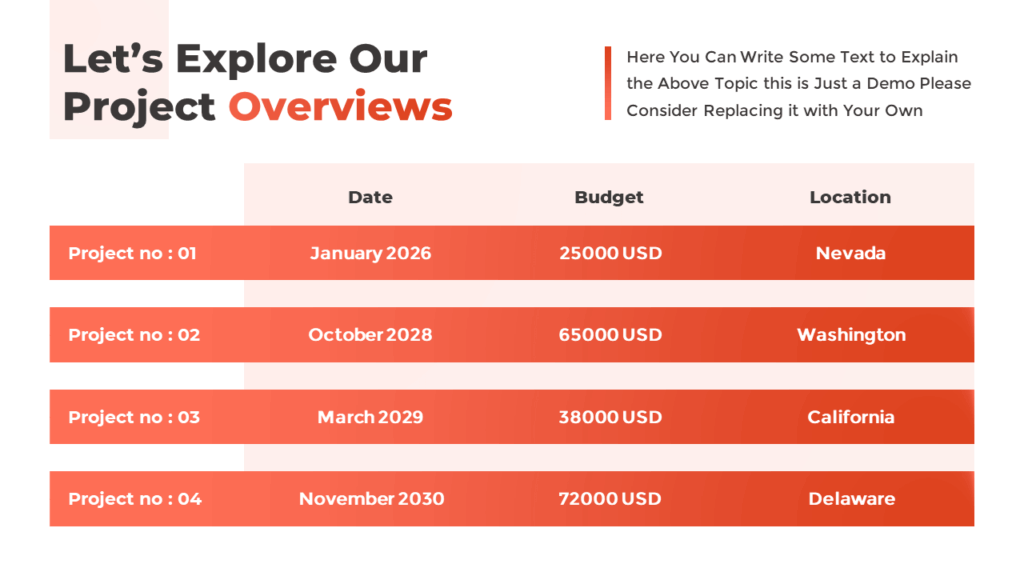
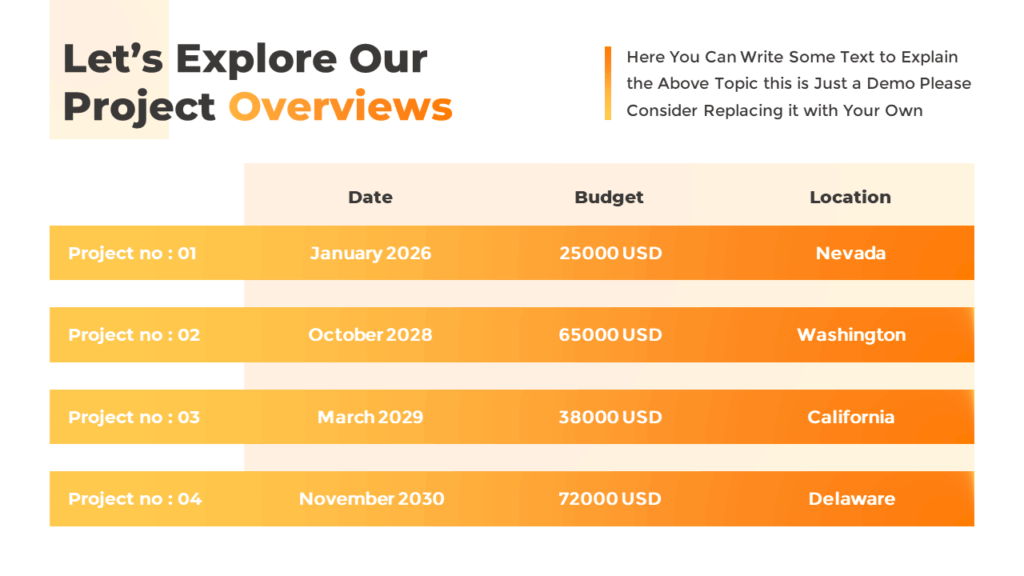
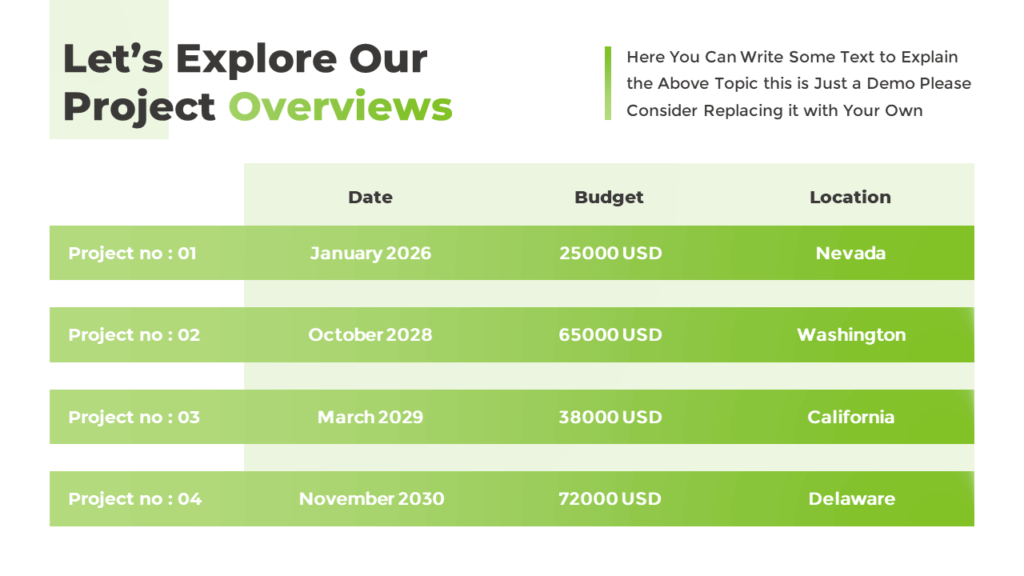
Explore the Color Variations:
Download this Free Table Slide:
Get this free comparison chart or table to showcase project details, key points, or side-by-side options. It is perfect for making structured reports or presentations more engaging.
Watch the Animated Slideshow Video:
Premium Member
Unlock exclusive and premium templates of PowerPoint School!
Hi there! We’re Team PowerPoint School. Become our premium member on Patreon and unlock exclusive access to all our premium templates.