Using a PowerPoint donut pie chart, one can show percentages, comparisons, or progress of different projects or works. You can use it in business meetings, academic, or project discussions to make data easier to understand.
PowerPoint Donut Pie Chart Slide
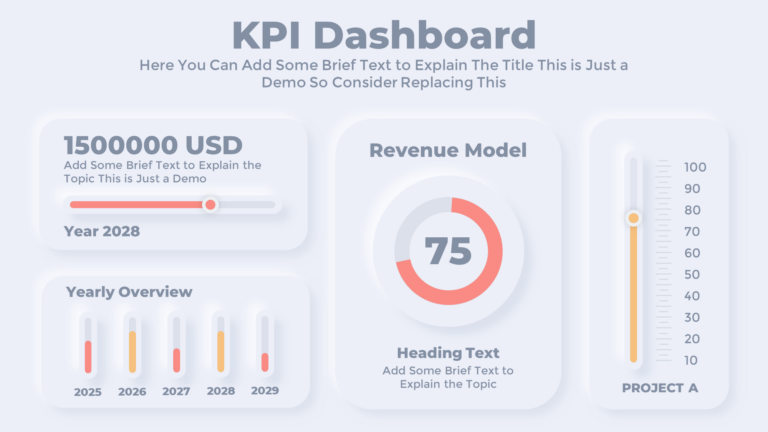
This free PowerPoint donut pie chart template features three easily editable circular charts to present data segments like percentages. Each chart has space below for text to explain the data in short. It is fully animated and great for showing statistics, survey results, or market share in presentations.
Explore the Available Color Options:
Take a look at the available color schemes with this donut pie chart template.


Get this Free PowerPoint Donut Chart:
This template can help display the progress or completion levels of any project in business or educational presentations. Download it now and explore our other free data chart slides for PowerPoint and Google Slides.
Watch this Presentation Slideshow:
Check out the video to see the template’s animations in action and explore our other free PowerPoint templates for more exciting designs.
265+ Infographic Slides Bundle:
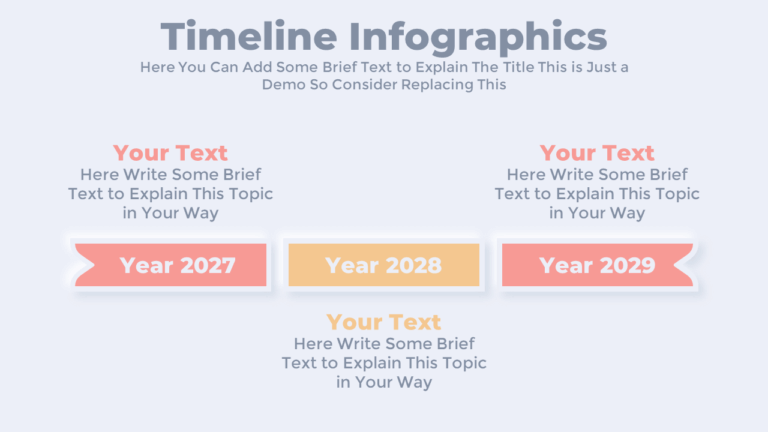
Try our animated neumorphic infographics bundle where you will get 265 unique infographic PowerPoint presentation slides.


Premium Member
Unlock exclusive and premium templates of PowerPoint School!
Hi there! We’re Team PowerPoint School. Become our premium member on Patreon and unlock exclusive access to all our premium templates.