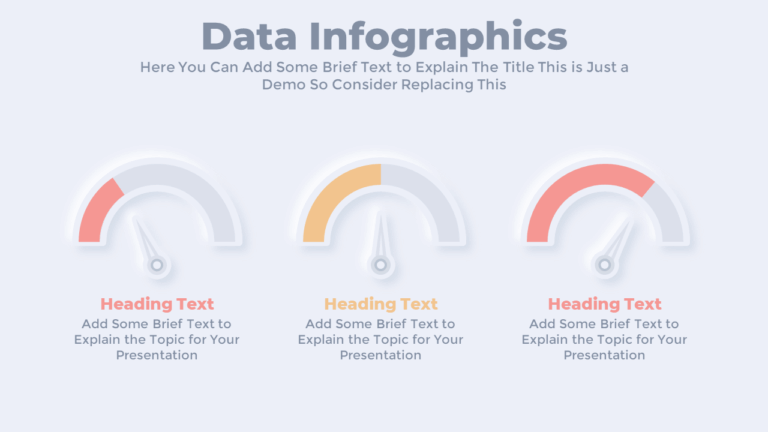
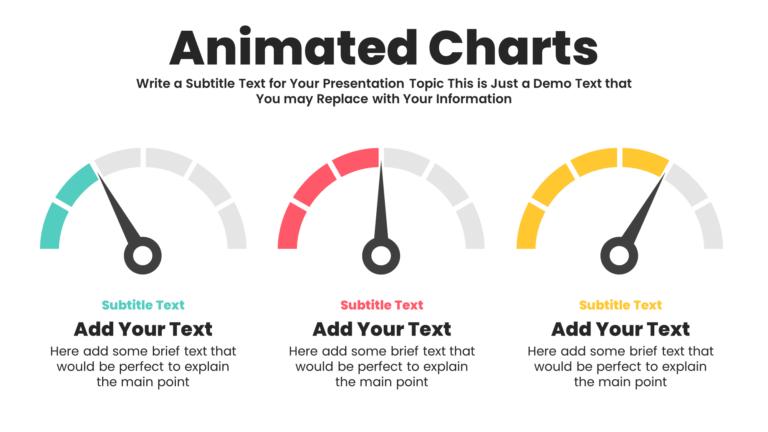
Free Editable Speedometer PowerPoint Infographic Slide
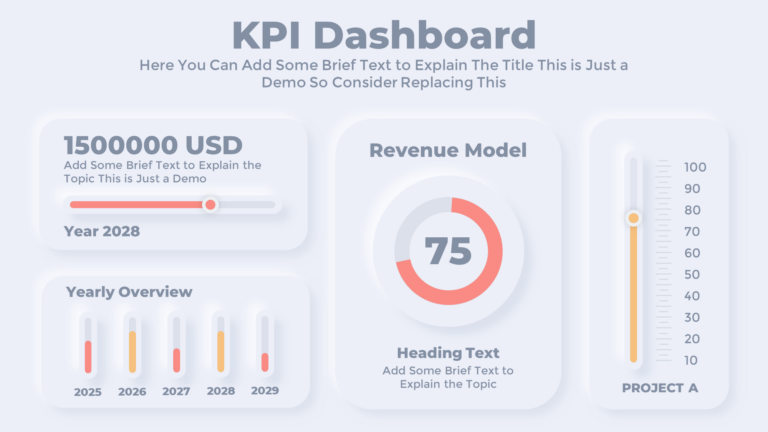
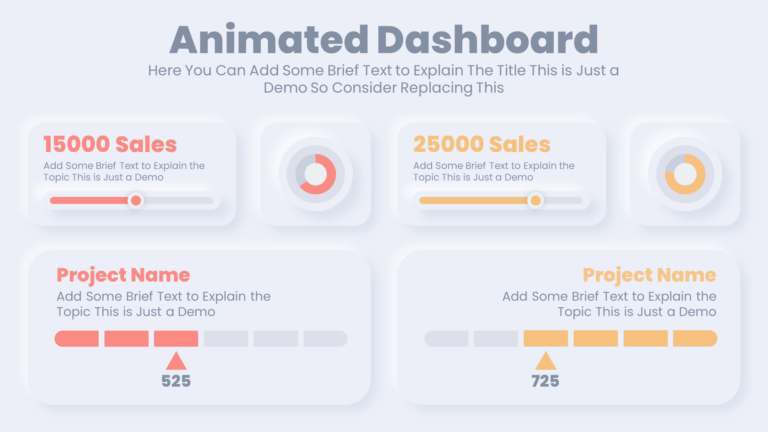
This free speedometer PowerPoint template helps you present data, progress, levels, or performance in a visual engaging way
One can use PowerPoint charts to visually represent data, making complex information easier to understand. These charts are essential in highlighting trends, comparisons, and progress in business, education, and research. You should use them whenever you need to present data clearly and persuasively. Our free templates feature engaging animations that can enhance the presentation’s impact, making your data not only informative but also visually appealing. Our charts are free to download and use, ensuring they are accessible to everyone. Additionally, they are compatible with both PowerPoint and Google Slides.


We hope this free template will help you make great presentations, and if you want, you can provide attribution to PowerPoint School.
For example, you can use the following text:
Like our templates? You can help us create more! Become a sponsor on Patreon and get access to special templates available only for our supporters.