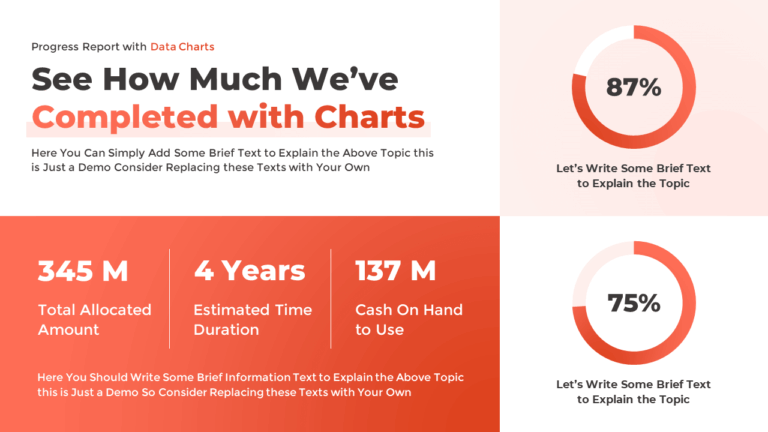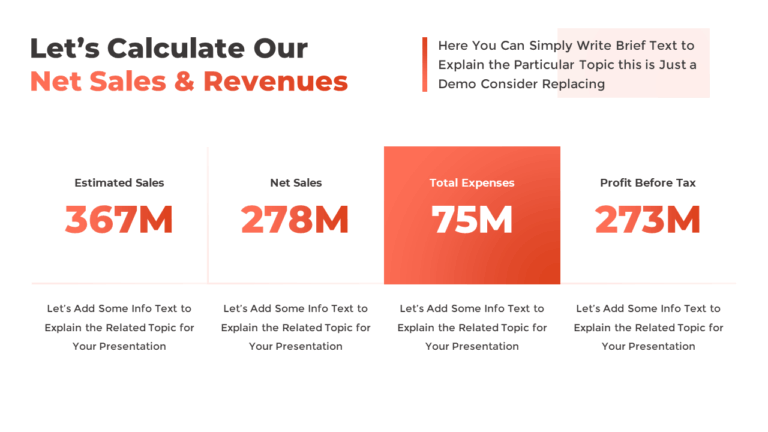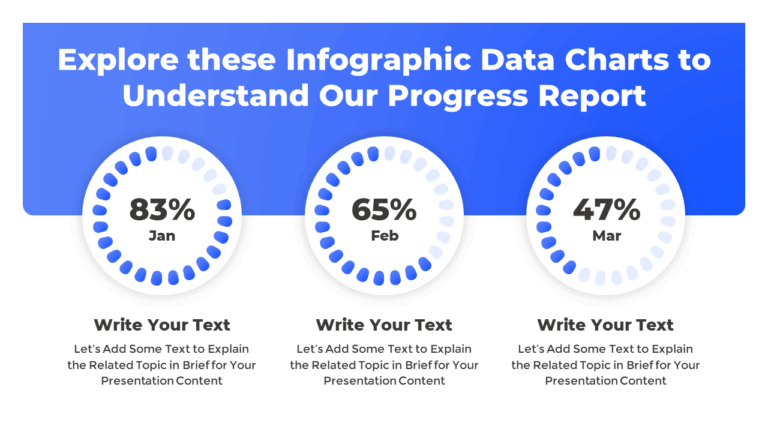
This free PowerPoint pie chart infographic template is perfect for showing percentage-based data in a modern or stylish layout. Whether you are presenting capital distribution, budgets, or spending breakdowns, this slide makes complex data easy to understand.
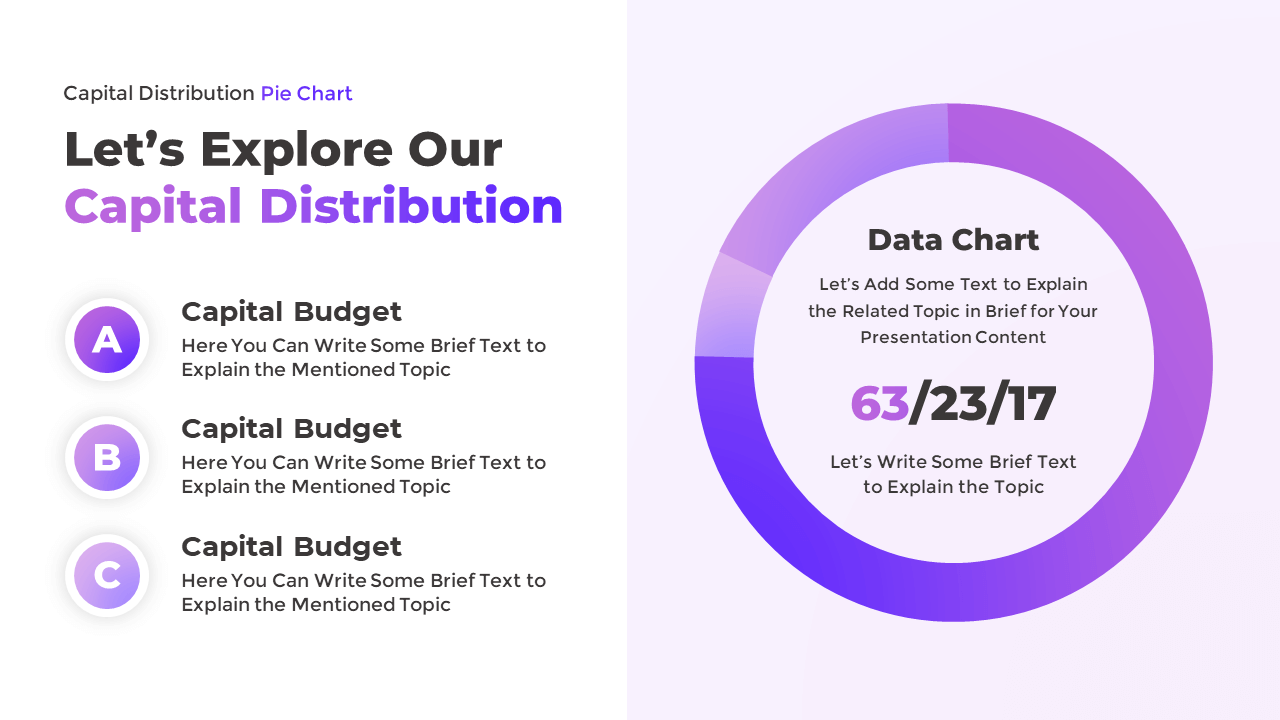
About this Pie Chart Infographic Slide
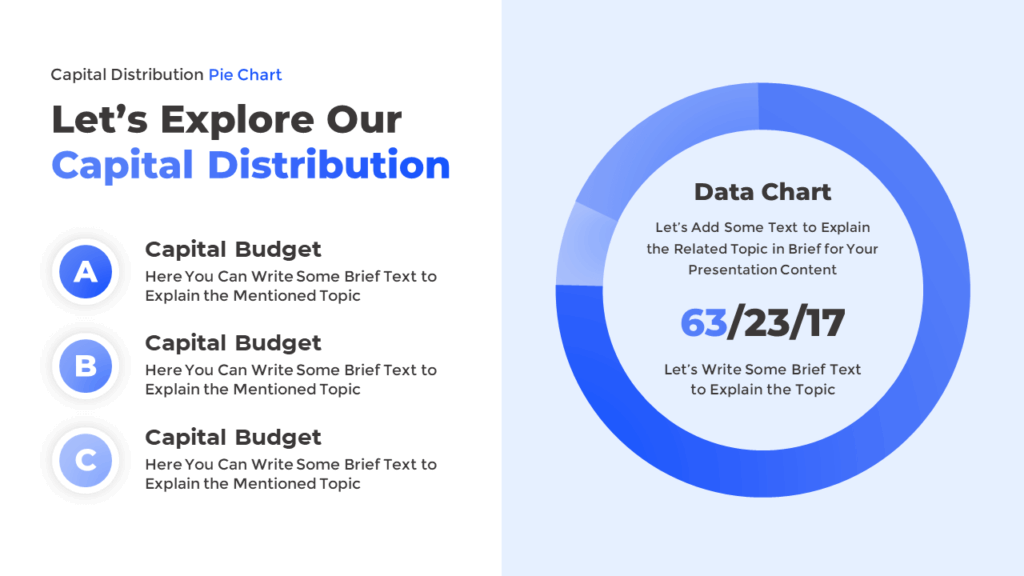
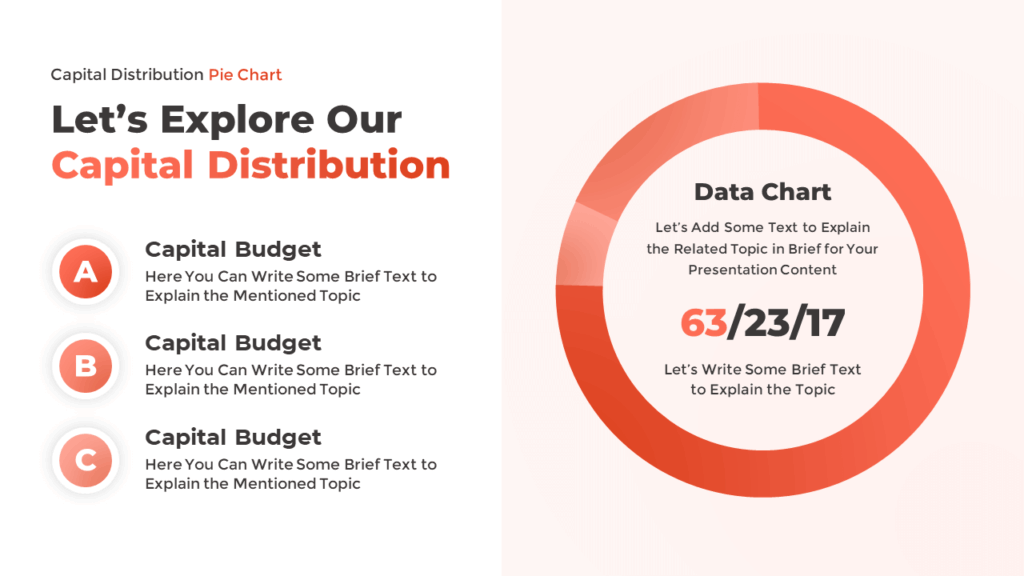
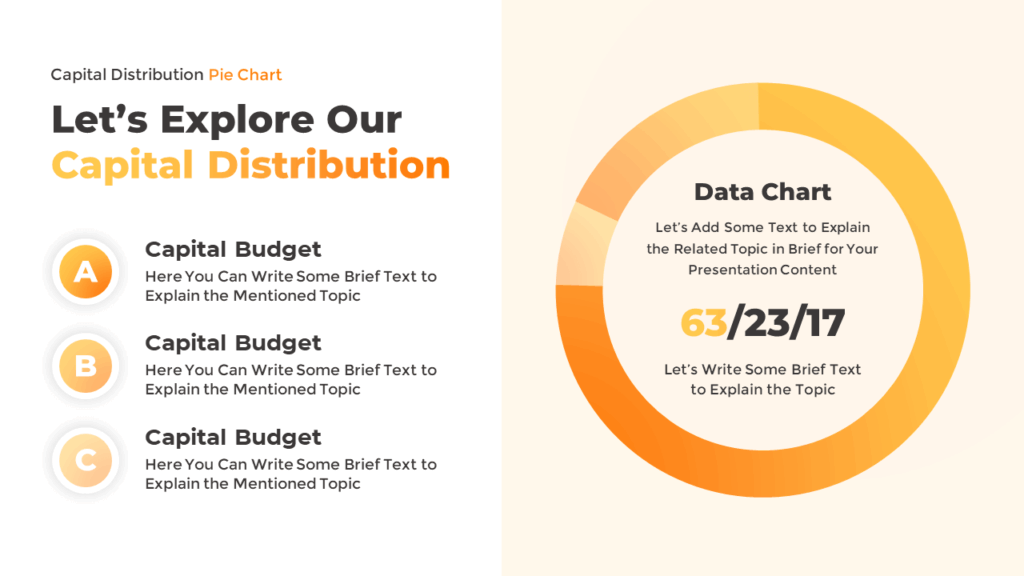
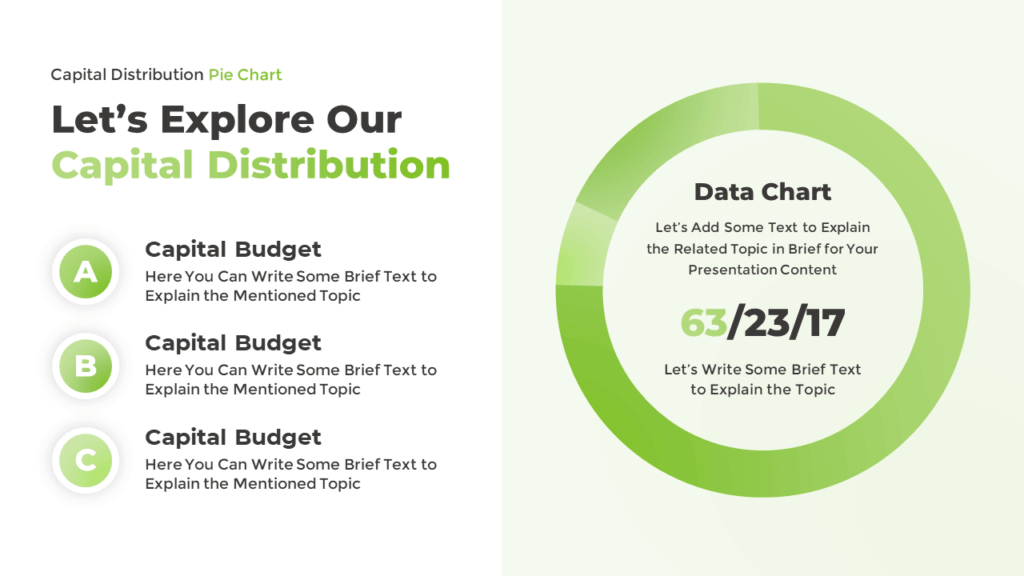
The slide features a large circular pie chart on the right and three labeled sections on the left. Each section has editable text for explanations. The pie chart values are also editable, so you can match your actual data. It includes smooth PowerPoint animations that make the visuals more engaging. The template works well in both PowerPoint and Google Slides.
Explore the Available Color Variations:
Download this Free Pie Chart Slide:
Get this free pie chart infographic template to visualize data professionally. It is simple to customize and great for showing data percentages in reports or presentations.
Watch the Animated Slideshow:
This data chart slide works great in business meetings, marketing reports, and company profiles. Explore more of our free PowerPoint templates to enhance your presentations.
Check Slides from Other Categories:


Premium Member
Unlock exclusive and premium templates of PowerPoint School!
Hi there! We’re Team PowerPoint School. Become our premium member on Patreon and unlock exclusive access to all our premium templates.