This PowerPoint progress bar template helps you showcase performance or task completion clearly. Use it in monthly reports, project updates, or KPI presentations to track progress easily. It is especially useful when you want to highlight how much of a task or goal is achieved.
About this PowerPoint Progress Bar Slide
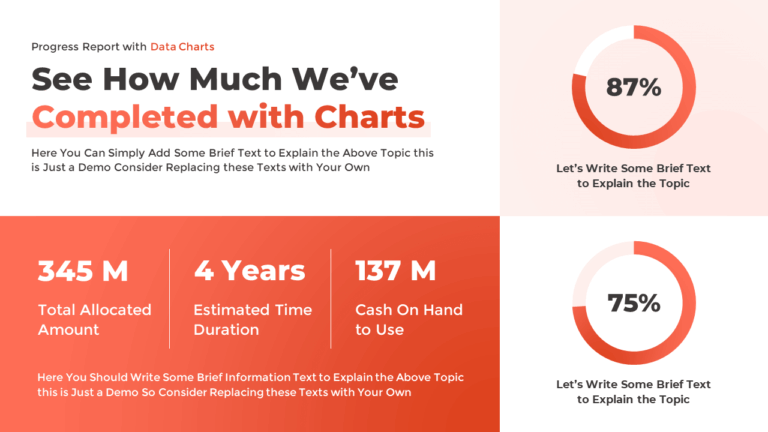
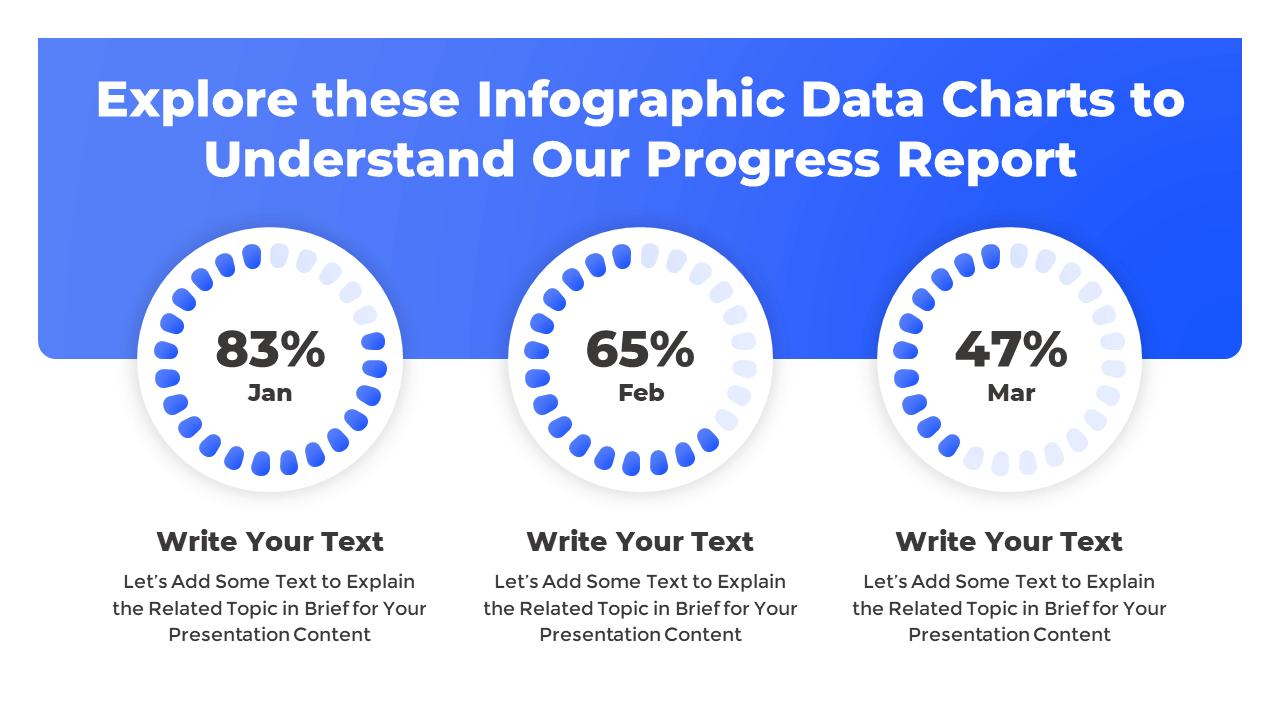
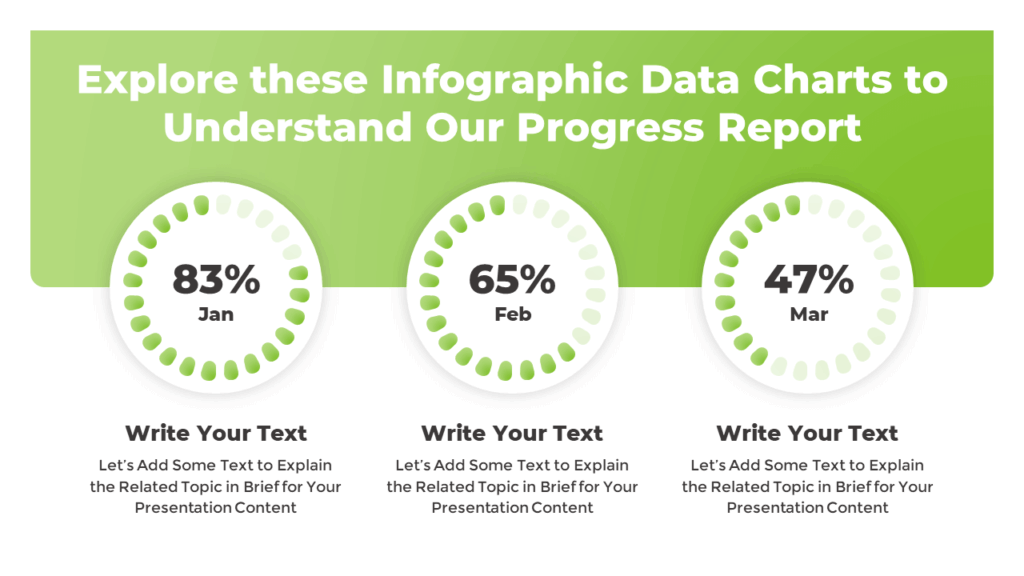
The layout features 3 circular progress rings, each displaying a percentage of completion with editable text boxes below for brief explanations. Smooth PowerPoint animations fill the rings, creating a visually engaging effect. It is fully compatible with both PowerPoint and Google Slides.
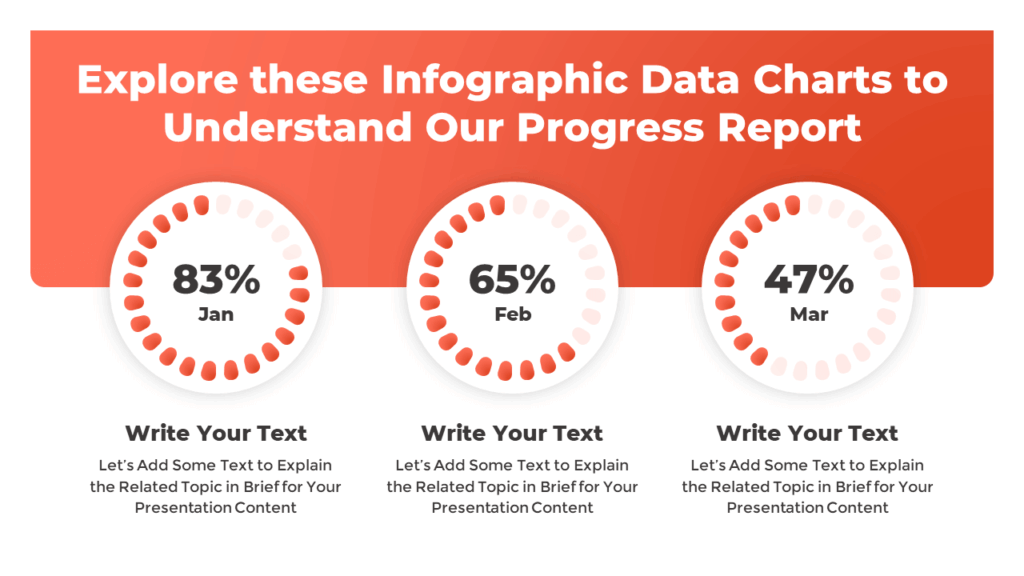
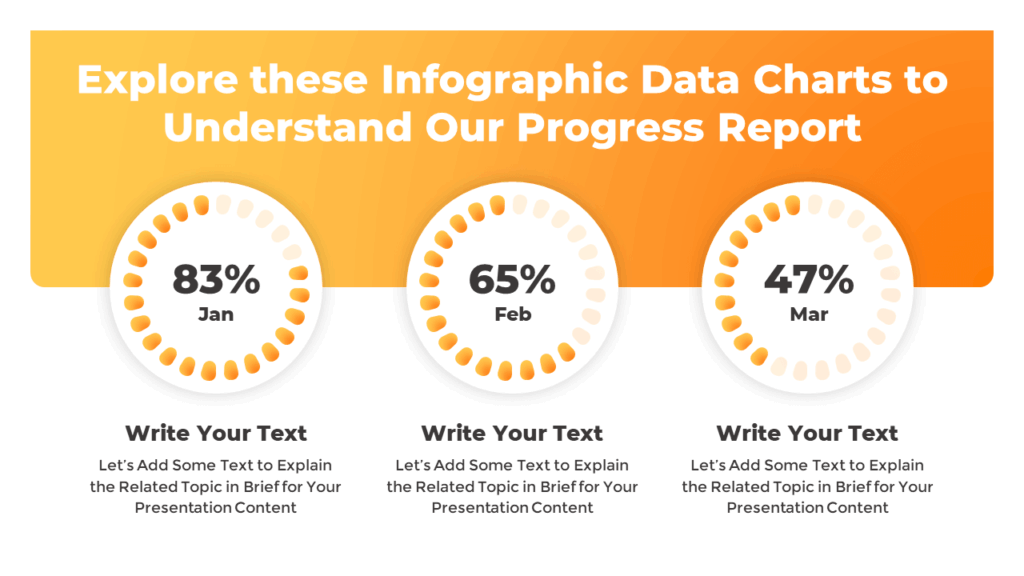
Explore the Available Color Options:

Download this Animated Progress Bar:
Get this PowerPoint progress bar template to present your task or project status visually. It is only available to our Patreon supporters. Also, do not forget to check out our other free PowerPoint templates, too.