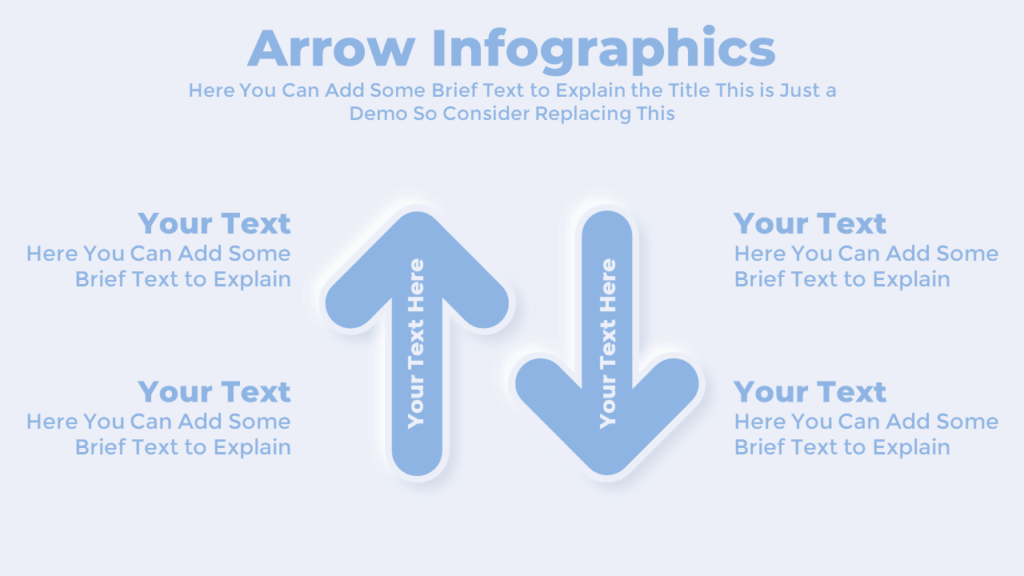
This arrow PowerPoint infographic template is perfect for showing direction, progress, or comparisons in a clear and engaging way. You can use it to explain paths, before-and-after scenarios, or decision-making steps. Its bold, two-directional arrows make your content easy to follow.
About this Arrow PowerPoint Template
The template includes vertical arrows pointing in opposite directions. Each arrow has an editable text space, allowing you to write directly on the shape. You can use this layout to show options, market changes, or process outcomes. The animations in PowerPoint guide the viewer’s attention smoothly.
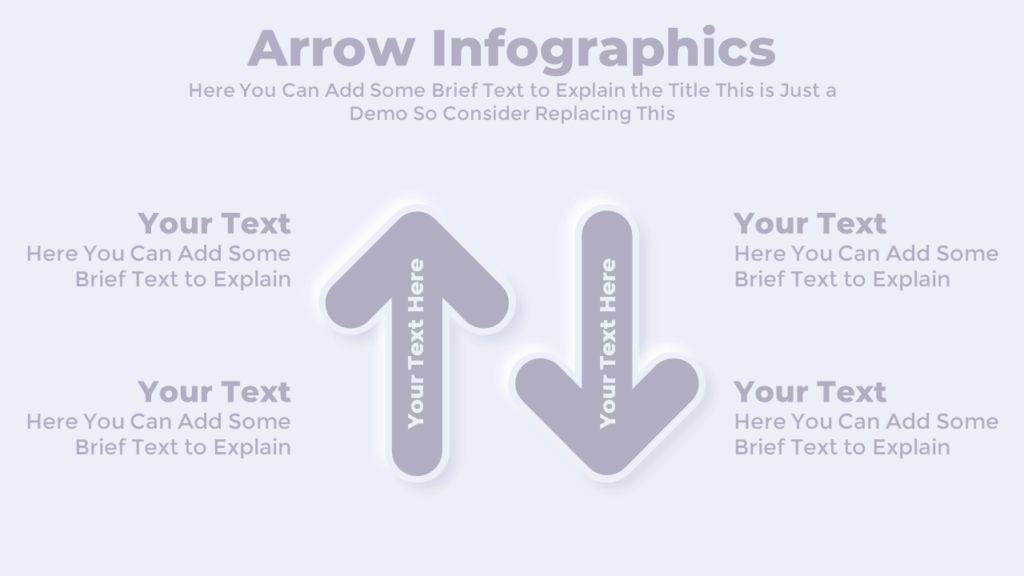
Color Options for this Presentation Slide:
Download this PowerPoint Template:
Get this free arrow PowerPoint infographic slide to show direction, comparison, or steps. Also, you can explore our other free PowerPoint templates for more variations.
Watch the Animated Slideshow Video:
Premium Member
Unlock exclusive and premium templates of PowerPoint School!
Hi there! We’re Team PowerPoint School. Become our premium member on Patreon and unlock exclusive access to all our premium templates.