
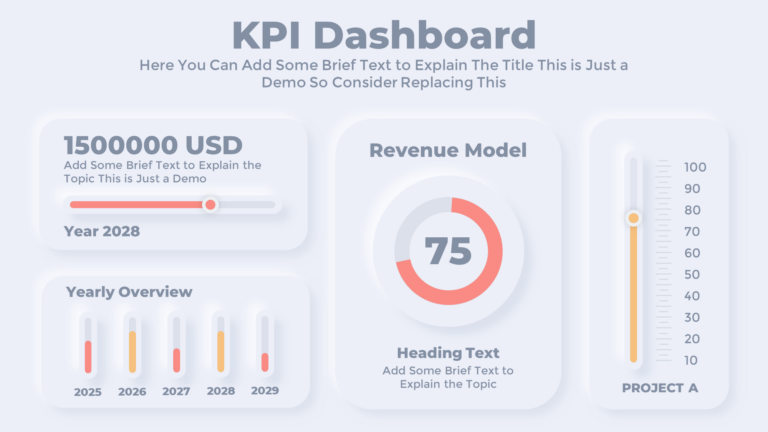
A KPI dashboard showcases all key performance indicators in one place. Today’s template is all about organizing your KPI dashboards in the most engaging way with the help of PowerPoint design tools and animations. Even, this template has a modern design trend with a Neumorphism effect that makes it unique and attractive.
About this Free Neumorphic Animated KPI Dashboard Template
Whether you’re presenting your sales data, project milestones, or other key business stats, this interactive PowerPoint template can help you increase engagement throughout your presentation. So, we have designed and organized this template with interactive charts and graphs that are easily editable. Moreover, it is fully animated and compatible with any version of PowerPoint.
Features of this animated PowerPoint KPI dashboard template:
- Animated KPI dashboard for presentation
- Suitable for presenting data and information
- The sales KPI dashboard demo is included
- Animated Neumorphic design elements
- Has a dynamic visual representation
- Organized interactive charts and graphs
- Easily editable in any version of PowerPoint
- Free to download and use for our users
Watch the Template & Tutorial Video:
Learn how to create a Neumorphism effect in PowerPoint as well as create an animated KPI dashboard for your presentation. Visit our YouTube channel for more awesome PowerPoint tutorials.
Get this animated PowerPoint KPI dashboard template:
Download this animated PowerPoint KPI dashboard that has a Neumorphic effect and can help to make your KPI slides far better than others.
More Details about this animated PowerPoint KPI:
With this Neumorphic KPI template, you will get multiple PowerPoint slides with 2 different color combinations. This KPI template has a few blocks to present animated performance indicators such as pie charts, progress bars, text boxes, etc. It can simply elevate your presentation quality and help to impress your audience. So, try it now for free! In addition, you can check out our Neumorphic Infographics bundle of 265+ fully animated PowerPoint Presentation Slides that is available to our premium members only.
Check Our 265+ Fully Animated Neumorphic Infographics Bundle:
You can get access to our amazing animated neumorphic infographics bundle where you will get 265 unique infographic PowerPoint presentation slides.


This bundle is available for our premium members in Patreon and Buy Me a Coffee sponsors. Check it out now! and level up your presentation slide design quality using this neumorphic animated infographics bundle.
Frequently Asked Questions:
Here, we have tried to answer some of your queries about this animated PowerPoint KPI dashboard template.
What does Neumorphic design mean?
Neumorphic or Neumorphism is a design trend that has a minimalist appearance where elements and background are in the same color and are separated by subtle border shadows. It gives a feel that the elements are floating over the slide.
Where to use this free PowerPoint template?
If you have a data-driven presentation, this animated KPI dashboard can be very useful for creating a modern and dynamic PowerPoint slide.
How to edit the template file?
The editing process is very simple. Just replace the demo texts with your data or information and to understand the animation process, please watch the tutorial video.
Which font have we used in this template?
We have used the Poppins font family (a free Google font) but you can use your preferred font.
Do we have more free PowerPoint templates?
Yes! In PowerPoint School, we have a collection of free PowerPoint animation and presentation templates that are easily editable and even compatible with other platforms such as Google Slides, Keynote, and Canva.
Premium Member
Unlock exclusive and premium templates of PowerPoint School!
Hi there! We’re Team PowerPoint School. Become our premium member on Patreon and unlock exclusive access to all our premium templates.


Leave a Comment