
Showing an infographic progress report in PowerPoint or Google Slides is important because it clearly shows how much a project has progressed. A well-designed progress report template makes this information easy to understand and visually appealing. You can use donut pie charts to show completion percentages, which helps viewers quickly see the status of different projects. This type of chart is great for managers and teams who need to track project milestones or how resources are allocated.
About this Animated Infographic Progress Chart
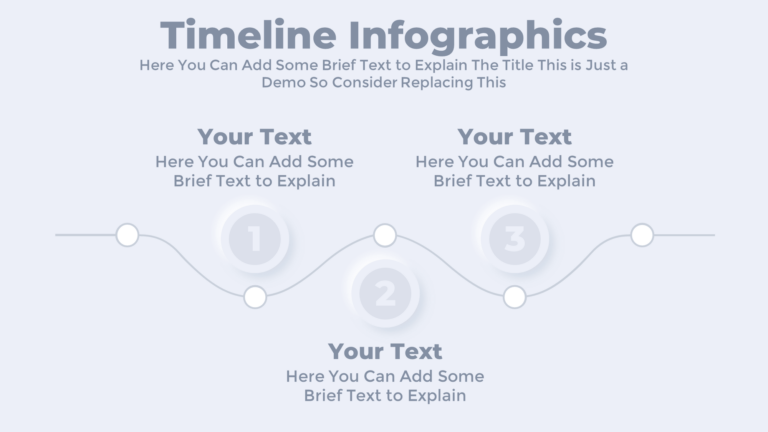
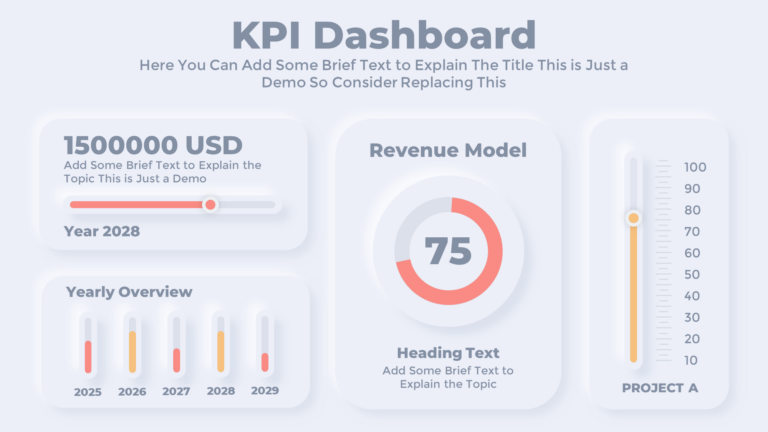
This free PowerPoint template features donut pie charts, perfect for showing progress reports or comparing completion percentages across three projects. It can illustrate how much work has been completed or show how resources are allocated. The template has a modern neomorphism design with subtle shadows around the shapes. It also allows users to easily adjust the percentage values to suit their needs.
Color Options for this Chart Template:
Let’s take a look at some of the color variations, including gradient options, that you will receive with the template file.


Features of Progress Chart Template:
- You can use this donut pie chart template to display progress reports or compare completion percentages across three different projects.
- It is suitable for comparing progress year-to-year, visualizing budget allocations, or illustrating sales distributions.
- This free PowerPoint template includes eye-catching animations and allows users to easily adjust percentage values.
Get this Free Infographic Progress Chart:
Download this free animated PowerPoint template and showcase your progress report through interactive charts. Also, you can explore our other free neumorphic PowerPoint templates as well.
Watch the Video of this Progress Pie Chart:
This infographic progress chart includes a fly-in animation with a smooth bounce effect, making it eye-catching during the slideshow. So, watch the video to learn more about this template.
Explore More Infographic Slides:
You can also explore our fully animated infographic bundle of over 250 slides, featuring a neomorphism design style. This bundle is exclusively available to our Patreon and Buy Me a Coffee supporters.


Frequently Asked Questions:
Here, we have tried to answer some of your questions about this free animated PowerPoint infographic progress pie chart template.
Why should I use an infographic progress report?
Using an infographic progress report in presentations like PowerPoint or Google Slides is important because it clearly displays how far along a project is. The visual format makes it easier for your audience to understand the progress quickly.
Who can benefit from using this donut pie chart template?
Managers and teams who need to track project progress or resource allocations will find this template particularly beneficial.
Premium Member
Unlock exclusive and premium templates of PowerPoint School!
Hi there! We’re Team PowerPoint School. Become our premium member on Patreon and unlock exclusive access to all our premium templates.


Leave a Comment