This free 3-step infographic timeline template is perfect for presenting annual goals, strategic phases, or key achievements over three years. It helps you show business progress or project development in a clean and simple format. You can use it in annual reviews, roadmaps, or milestone-based reports.
About this 3 Step Infographic Slide
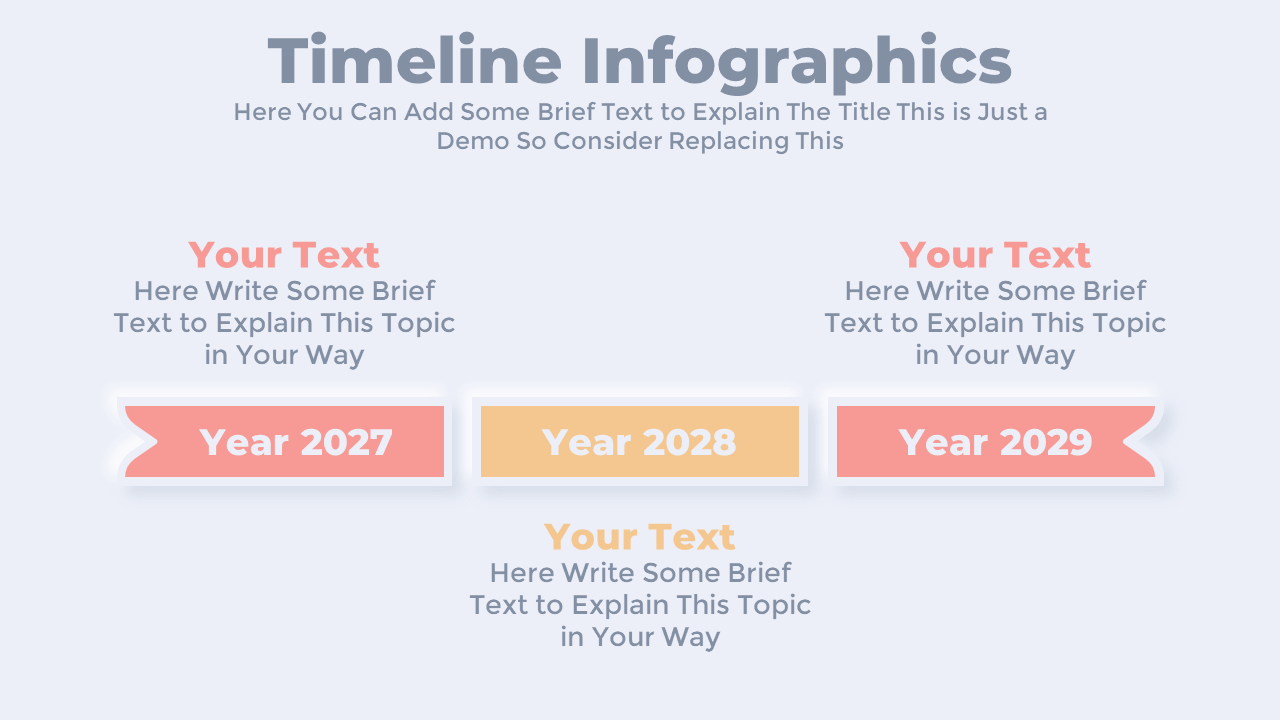
The template features a horizontal 3-year timeline with three colorful banners. Each banner includes a clear title and a short description area where you can easily add your content. This design is great for highlighting yearly progress or planning goals. The layout is animated in PowerPoint, which adds a smooth visual flow to your presentation. You can also edit it in Google Slides.
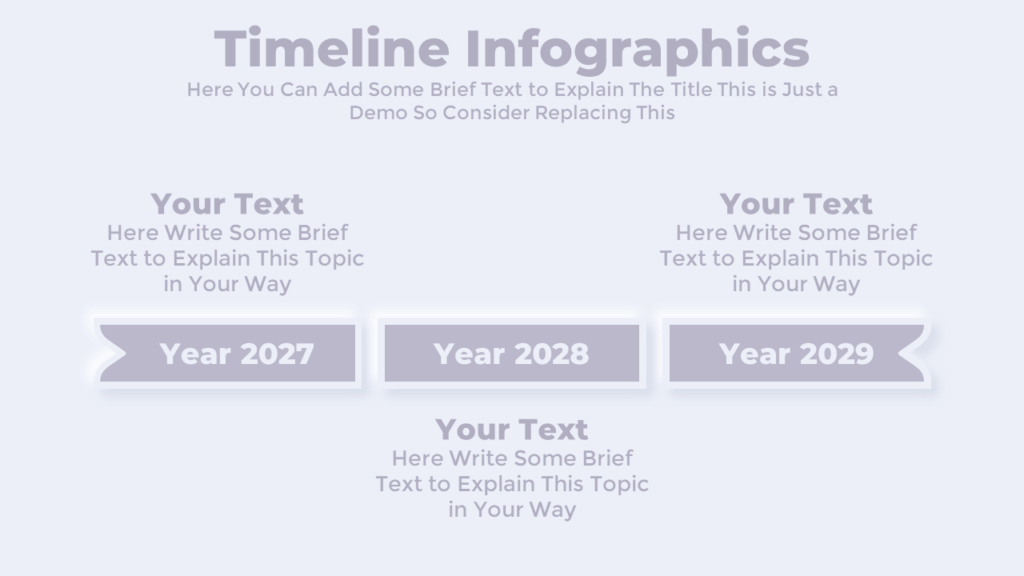
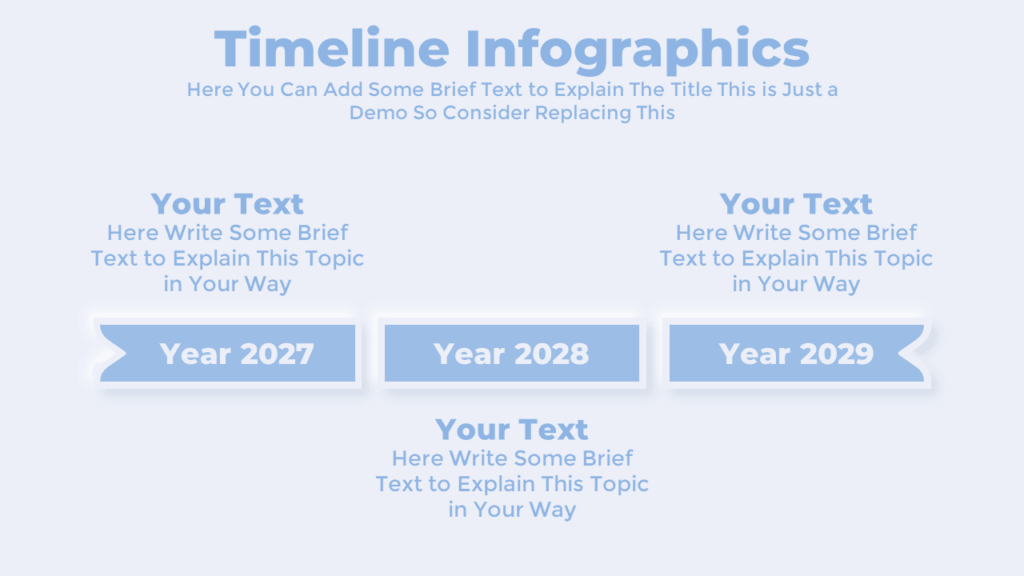
Available Color Options for this Template:
Download this 3-Step Infographic Slide:
Get this free 3-step infographic PowerPoint timeline template to clearly show your business progress or yearly goals. It is easy to customize, animated, and perfect for project overviews or strategy presentations. Just edit the text, and you are ready to present.
Watch the Animated Slideshow Video:
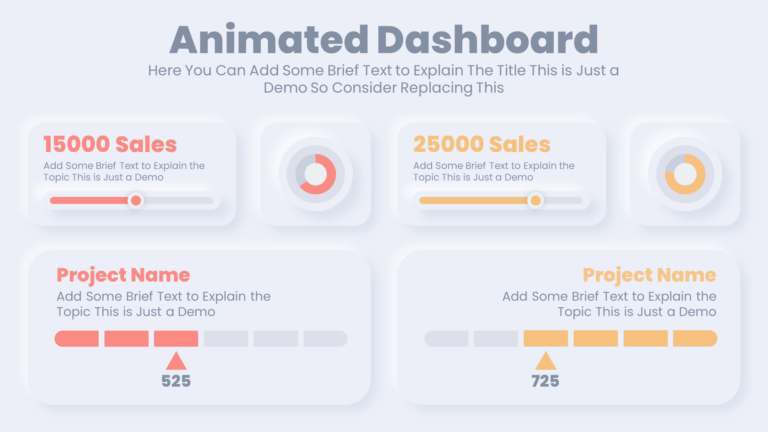
Check Our 265+ Fully Animated Neumorphic Infographics Bundle:
You can get access to our amazing animated neumorphic infographics bundle where you will get 265 unique infographic PowerPoint presentation slides.


Premium Member
Unlock exclusive and premium templates of PowerPoint School!
Hi there! We’re Team PowerPoint School. Become our premium member on Patreon and unlock exclusive access to all our premium templates.