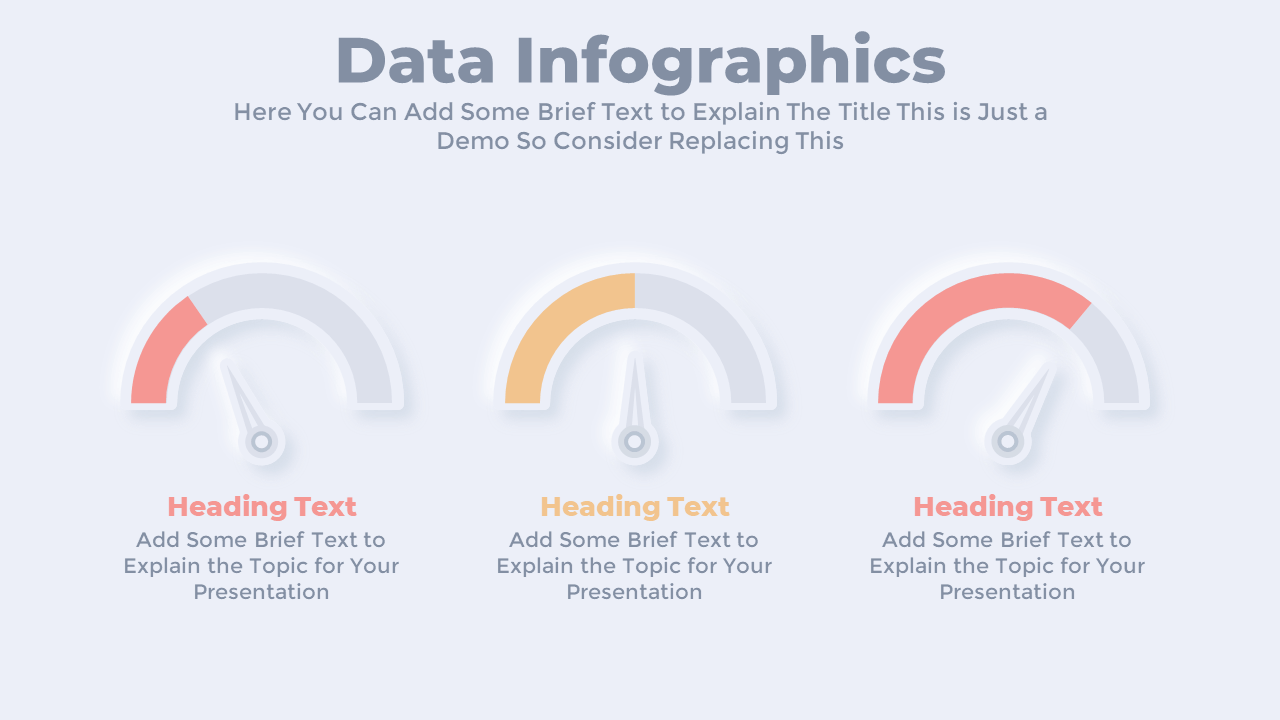
This free speedometer PowerPoint template helps you present data, progress, or performance in a visual way. You can use it to track KPIs, compare goals, or show levels like risk or satisfaction. The gauge chart design gives a clear snapshot of key metrics.
About this Editable Speedometer PowerPoint
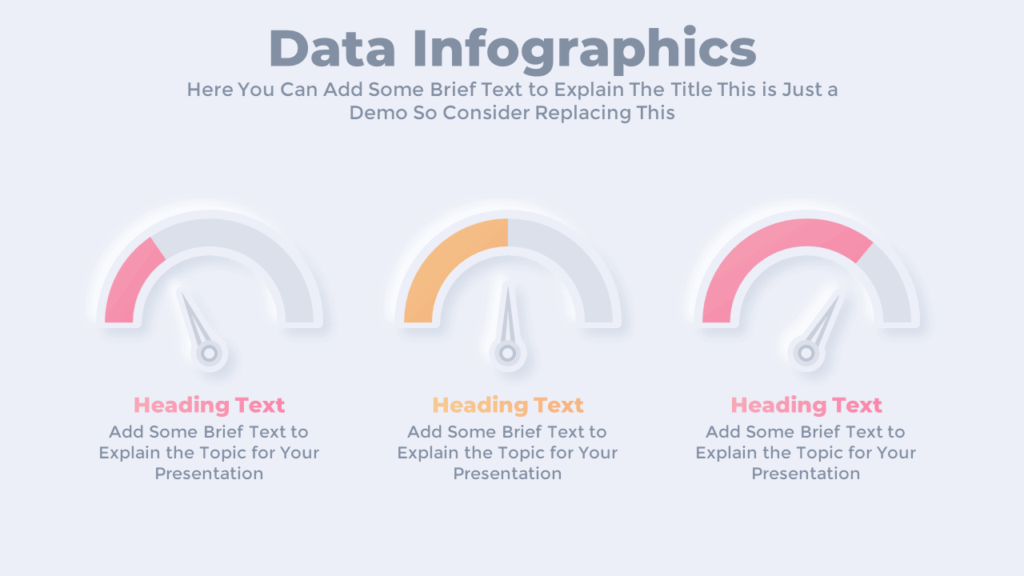
The slide includes three semi-circular speedometers, each with different needle positions. You can edit the titles, values, and colors to match your data. These meters make it easy to compare results side-by-side or show changes over time. The template is fully animated in PowerPoint.
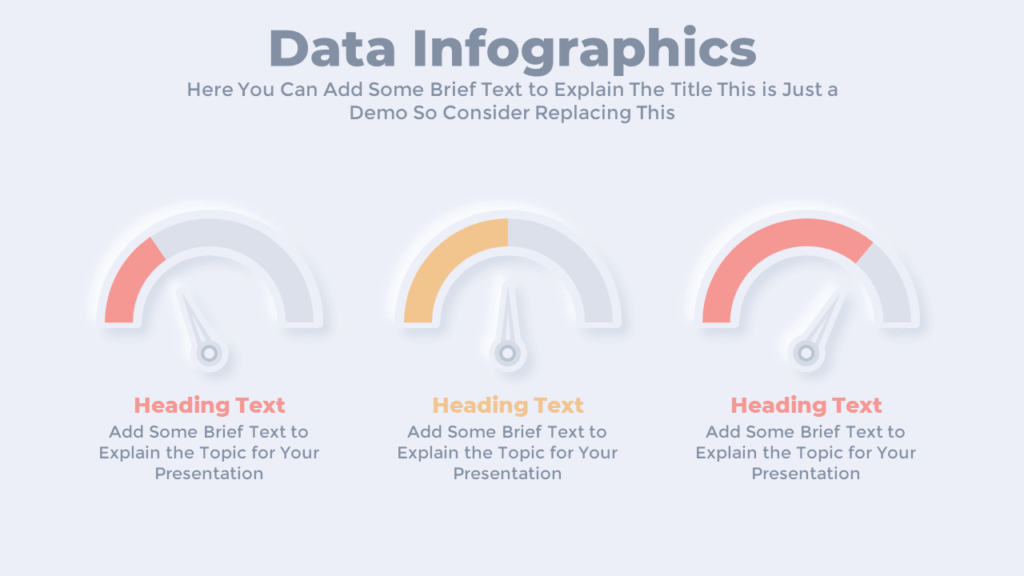
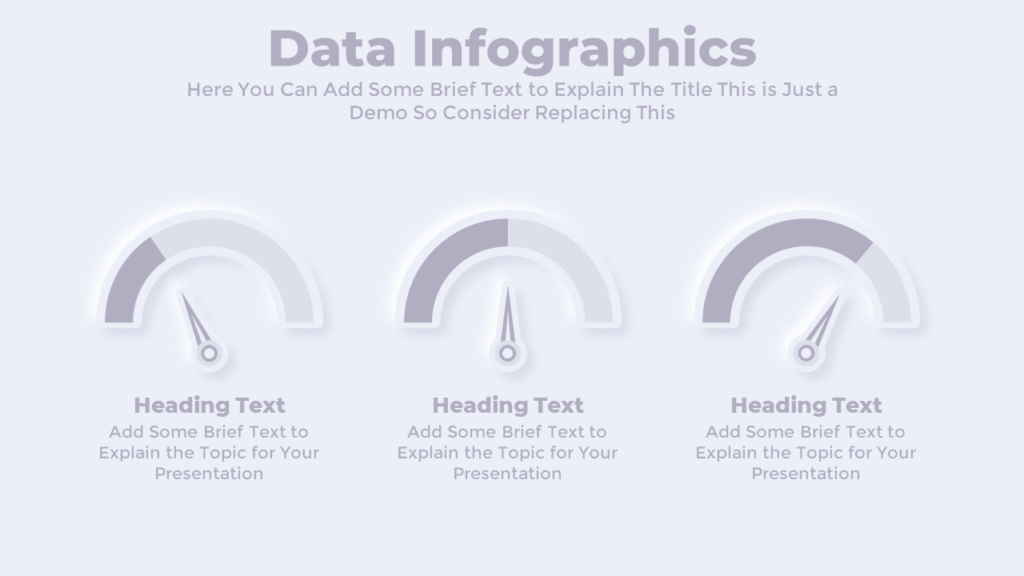
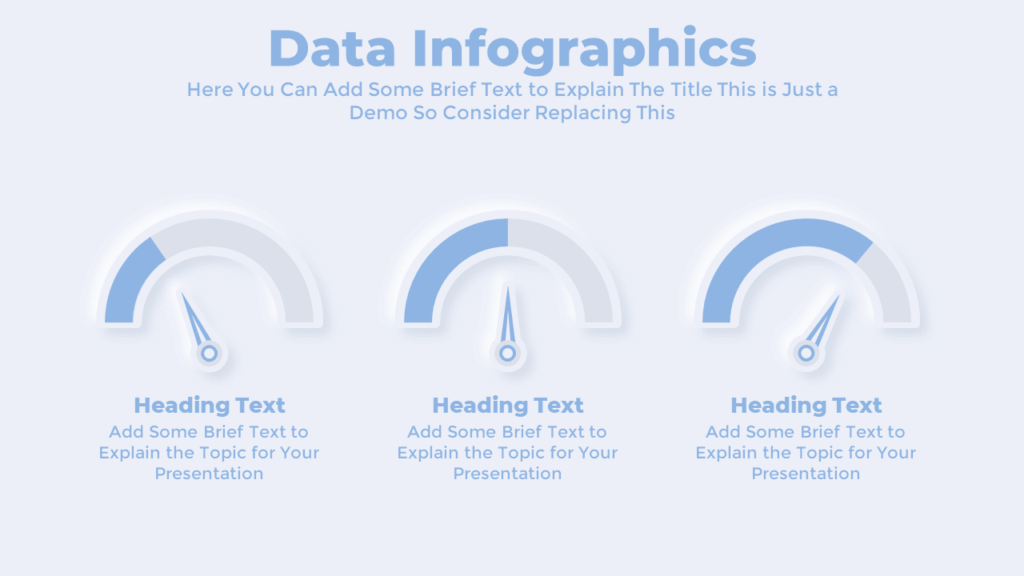
Color Options for this Infographic Template:
Download this PowerPoint Slide:
Get this free editable speedometer template to show performance reviews, customer feedback, productivity tracking, or any data-driven report. You can customize the dials to reflect your own data and give your presentation a professional edge.
Watch the Animated Slideshow Video:
Use this speedometer slide to showcase key data at a glance. Explore more free PowerPoint templates that make your presentations clearer, more engaging, and informative.
Premium Member
Unlock exclusive and premium templates of PowerPoint School!
Hi there! We’re Team PowerPoint School. Become our premium member on Patreon and unlock exclusive access to all our premium templates.